Design, conception and programming for interactive infographics: make data efficient, instructive and fun
Infographics are all the more efficient when the viewer can interact with them. Interactive graphics created in HTML5, or vector data created and tagged in SVG can be integrated into websites, animations or used in presentations. Facts can also be created in a user-friendly way using animated educational clips.
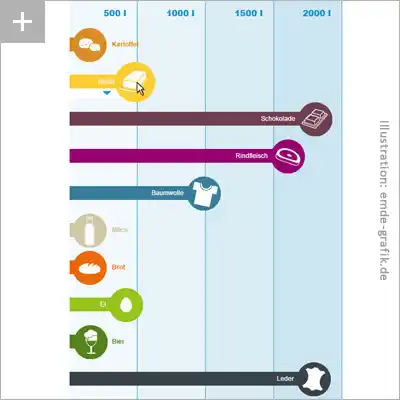
Illustration + Programming:
Interactive Graphic about water consumption in the agricultural sector
(Coding: Frank Langner)
View graphic in an external window (German)
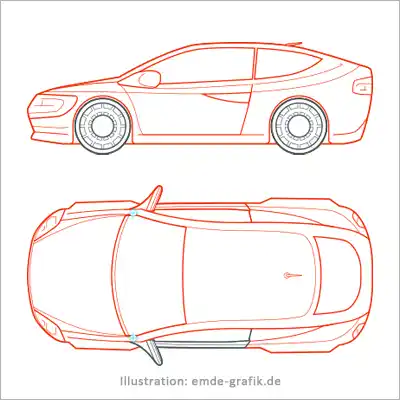
Illustrations for interactive infographics:
Car technology
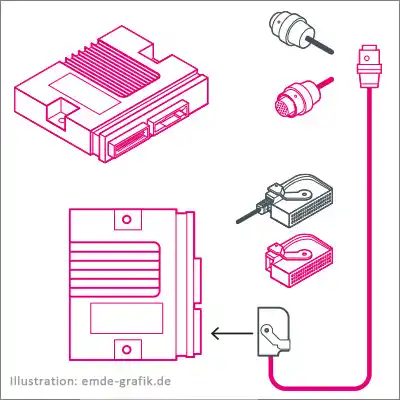
Illustrations for interactive applications:
Measurement technology
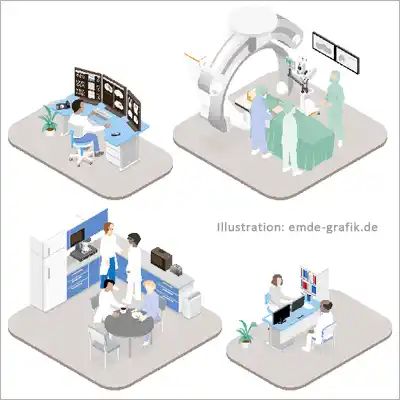
Isometric medical illustration:
Medical devices
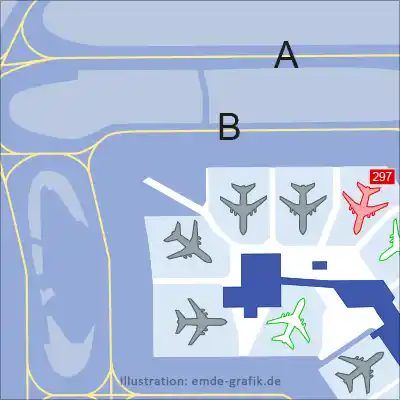
SVG-tagged illustration for navigation software
GUI-design: Icons and buttons for different internet purposes
Frequently asked questions about interactive infographics (FAQ)
What is an interactive infographic?
An interactive information graphic can be operated and changed by the viewer and is used on the Internet, in computer applications, on cell phones or on terminals. For example, you can click on individual areas to call up additional information, change the structure, zoom in or out, change colors and much more.
What do I need to bear in mind when creating interactive infographics?
With interactive information graphics, it is important to clarify very precisely in advance the technical environment in which the illustration is to be used. It must also be planned very precisely what exactly is to be animated and how, how much space is available, how the graphic will behave in a responsive design and to what extent it should be expandable. In addition to all of this, the target group, corporate design, multilingualism, and timings also need to be clarified.
Who are interactive information graphics for?
There are many possible applications. They are popular in museums, for example, where you can use an app to make a dinosaur walk through the room, but they are also used in configurators for furniture, clothing, and technical devices. Another application is survey tools or diagrams for clicking and modulating.
